

The home page of your provider dashboard is not a picture, it is a to-do list. Every tile shows a number that tells you what to do next. This article walks through the tiles from top to bottom and explains where each number comes from and what to do with it.
You reach the page through the topmost menu item, Dashboard.
Collected Feedbax reviews
The first tile shows the number of your approved Feedbax reviews, meaning reviews created directly on Feedbax. Imported reviews from Google, Trustpilot and other sources do not count here.
Below it sits a progress bar with a "remaining" figure. The bar aims at two targets:
Below 5 reviews the next target is 5 and the tile is red.
From 5 reviews the next target is 10 and the tile is orange.
From 10 reviews the tile is green.
Those two numbers are not arbitrary. From the sixth review you meet one of the five conditions for the top company badge, and from ten reviews with an average of at least 4.5 stars the top rated badge unlocks.
Clicking the tile takes you straight to Reviews > Phone Collection.
Overall rating
The second tile shows your average across all sources, with the total number of reviews and the number of sources they come from. Feedbax reviews and imported reviews are added together here.
Clicking it takes you to Reviews > Feedbax Overview.
Distribution of stars
The third tile breaks down how many reviews fall on 5, 4, 3, 2 and 1 star, each as a percentage and as an absolute number.
That is more useful than the plain average: an average of 4.6 made of fours and fives reads differently from the same average with a few ones in it. The "Collect reviews" button takes you to the phone collection.
Quality of your profile
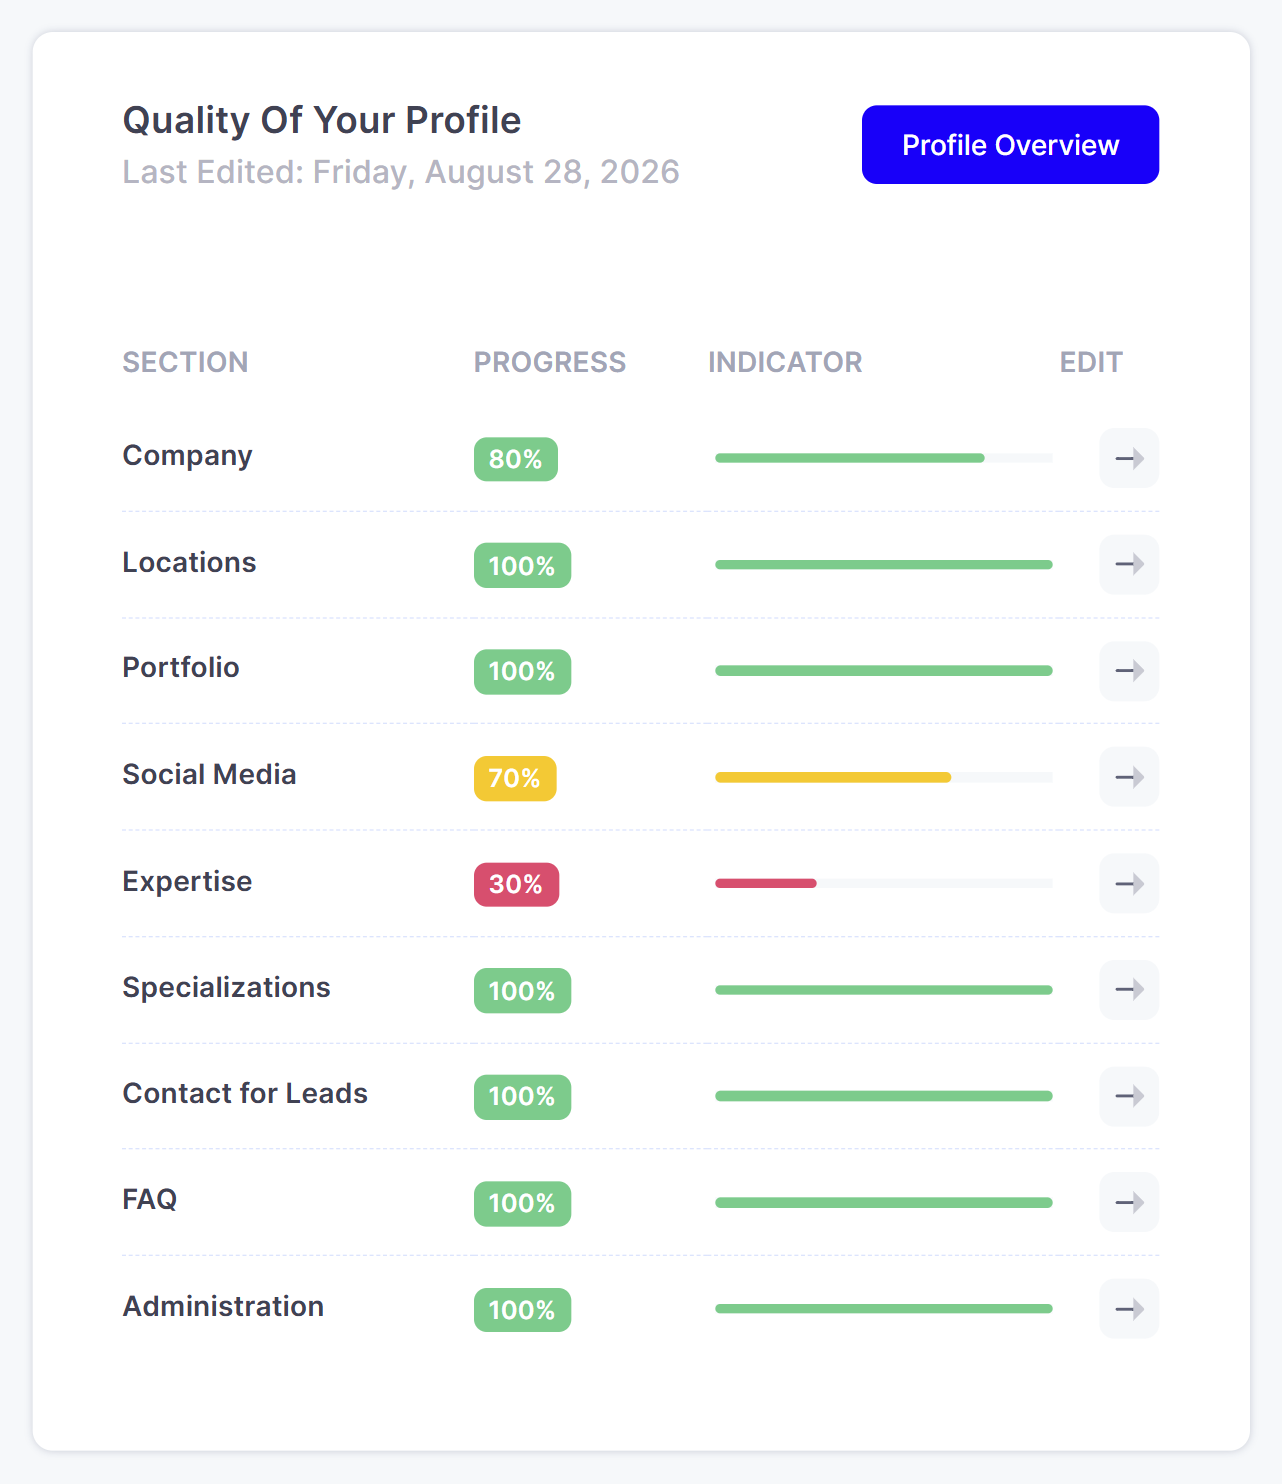
This table is the most important tile on the page. It lists nine profile sections, each with a progress percentage and a traffic light:
Company · Locations · Portfolio · Social Media · Expertise · Specializations · Contact for Leads · FAQ · Administration
The traffic light uses fixed thresholds. For Company: below 40 percent red, below 80 percent orange, otherwise green. For Locations and Portfolio: below 50 red, below 80 orange, otherwise green. For every other section: below 50 red, below 100 orange, and green only at a full 100 percent.
The last column holds a pencil per row that takes you straight to the matching edit page. Top right, the "Profile Overview" button opens the page that shows all sections together.
Above the table you see "Last Edited" with the date of your last profile change.
How the percentages are calculated
Every section has a fixed list of fields, and every filled field contributes a fixed share:
Company: ten fields at 10 percent each, namely name, slogan, founding year, header image, YouTube video, company description, logo, minimum budget, hourly rate and company size.
Locations: country, city, street and phone number at 25 percent each.
Portfolio: at least one case study 25 percent, more than two case studies another 25 percent, key clients 15 percent, awards 15 percent, an uploaded PDF 20 percent.
Social Media: every network entered 50 percent, capped at 100. Two channels are enough for the full score.
Expertise: at least one service 50 percent, at least one focus area 25 percent, more than one focus area another 25 percent.
Specializations: at least one industry 50 percent, more than one client segment 50 percent.
Contact for Leads: phone, contact person, photo, email and website at 20 percent each.
FAQ: the five questions at 20 percent each.
Administration: contact email 50 percent, contact phone 50 percent.
The profile progress you see at the top of every profile page is the average across these nine sections plus the Team section (team photo and team description at 50 percent each). Team has no row of its own in the table but counts towards the overall figure.
That overall figure is not cosmetic: to apply for a project request you need at least 50 percent profile progress.
Customizable review widgets
Next to the profile quality sits a preview of the Premium Badge, one of the six review widgets. It shows your overall rating, the number of reviews and the sources in a box you embed on your website.
This is more than self-promotion: an actually embedded widget is worth 100 points on your reputation score. Details are in Embedding review widgets on your website.
Your ranking
This tile lists every directory you are assigned to, with your current position in each one. If it says 2, you are second in that directory.
That gives you an immediate view of where you already lead and where there is room. How the ranking is calculated is explained in How does ranking in the directories work?.
Top competitors
The largest table on the page. You pick a directory and a sort order ("Feedbax Score" or "Verified First") at the top and then see the companies competing with you for the same clients, with these columns:
Feedbax Score, Delivery Score and Reputation Score for this directory
Uses Widgets: yes or no
Feedbax Reviews and Integrated Reviews
Expertise Percentage: the share this provider has assigned to the directory's service
Profile: profile progress in percent
Case Studies and Matching Cases: the total number of case studies and how many of them fit this directory
This table is the most honest view of your position the dashboard offers. Find your own row and compare it with the three rows above it. Almost always you see the reason immediately: a zero under Matching Cases, a No under widgets, or clearly fewer integrated reviews.
Upgrade your subscription
A teaser with four questions (higher ranking, more profile views, more project requests, more customer recommendations) and a button to the plan selection.
Recent reviews
At the very bottom a carousel runs through your latest reviews. It shows Feedbax reviews first. If you have none, it falls back to your imported sources in the order Clutch, Sortlist, Trustpilot, ProvenExpert, Google. If you have no reviews at all, a collect button appears instead.
What is not on this page
The home page carries no visitor statistics. You will not find profile views or impressions here. If you want to know how often your profile and website were clicked, look at the click table under Get Featured > Directories. It shows the organic clicks of the last 30 days with timestamp, device and origin. See Reading your clicks: what the performance table shows.
What order to work in
If you are short on time, work through the page like this:
Clear every red traffic light in the profile quality table. Red means this section is so empty that it costs you ranking.
Embed a widget if the competitor table shows "No" for you. That is 100 points for half an hour of work.
Raise your matching cases if there is a zero there. Without a matching case study you do not even enter the running for badges and the market leader list.
Collect reviews until the first tile is green.
Frequently asked questions
Why is my profile progress at 98 percent and not 100?
Because one of the ten sections is not full. Find the row with the lowest value in the table and click the pencil. Often the YouTube video or the header image is missing under Company, or the team photo is missing under Team.
The "Collected Feedbax reviews" tile shows 2 although we have over 100 reviews. Is that a bug?
No. This tile only counts reviews created on Feedbax. The rest are reviews imported from other portals. Both kinds feed into your score, but a Feedbax review counts eight times, an imported one once.
Why do I see companies in "Top Competitors" that are much smaller than us?
The table sorts by the score for the selected directory, not by company size. A small, tightly focused provider with many matching case studies can rank ahead of a large firm. That is exactly why the columns are worth reading.
Can I export the tables?
No, there is no export function. The values are snapshots and change with every update of the Feedbax score.